loc.txt
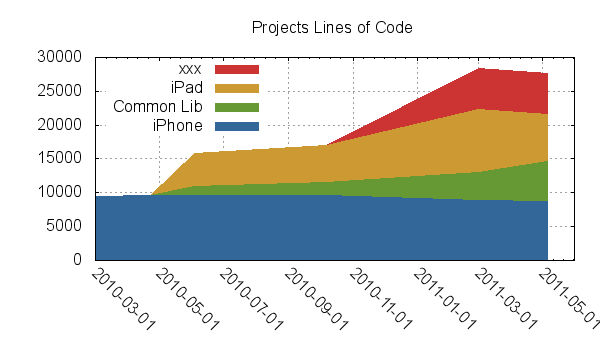
# date      iphone  common  ipad    xxx
2010-02-08  9370       0       0       0    # iphone 1.0
2010-04-22  9602       0       0       0    # iphone 2.0
2010-06-03  9602    1354    4820       0    # ipad 1.0
2010-10-07  9602    1869    5536       0    # ipad 2.0
2011-03-01  8892    4041    9356    6046    # xxx 1.0
2011-05-06  8648    5973    6960    6046    # iphone 3.0
loc.gp
set terminal png size 600, 350

set output "loc.png"

set title "Projects Lines of Code"
set key left

set timefmt "%Y-%m-%d"
set format x "%Y-%m-%d"
set grid

set xdata time
set xtics rotate by -45
set xrange ["2010-03-01":"2011-06-01"]

plot "loc.txt" using 1:($5+$4+$3+$2) title "xxx" with filledcurves y1=0 lt rgb "#cc3333", \
     "loc.txt" using 1:($4+$3+$2) title "iPad" with filledcurves y1=0 lt rgb "#cc9933", \
     "loc.txt" using 1:($3+$2) title "Common Lib" with filledcurves y1=0 lt rgb "#669933", \
     "loc.txt" using 1:2 title "iPhone" with filledcurves y1=0 lt rgb "#336699"
Drawing the chart
$ gnuplot loc.gp && open loc.png
map.txt
n_0_0   , n_0_1   , ..., n_0_100
...
n_2682_0, n_2682_1, ..., n_2682_100
heatmap.gp
set terminal png
set output "heatmap.png"
set size ratio 0.5
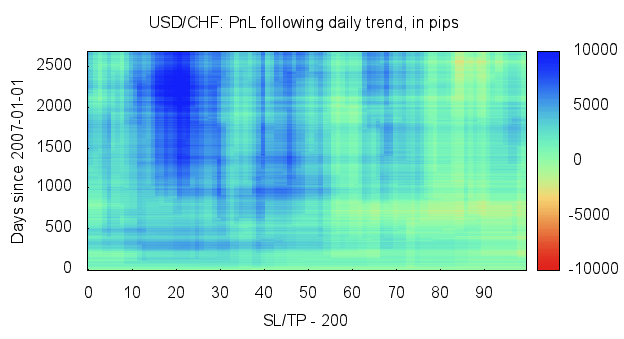
set title "USD/CHF: PnL following daily trend, in pips"
set xlabel "SL/TP - 200"
set ylabel "Days since 2007-01-01"
set tic scale 0
set palette rgbformulae 22,13,10
set palette negative
set cbrange [-10000:10000]
#unset cbtics
set xrange [0:99.5]
set yrange [0:2683]
set view map
splot 'map.txt' matrix with image
Drawing the map
$ gnuplot heatmap.gp && open heatmap.png