map.txt
n_0_0   , n_0_1   , ..., n_0_100
...
n_2682_0, n_2682_1, ..., n_2682_100
heatmap.gp
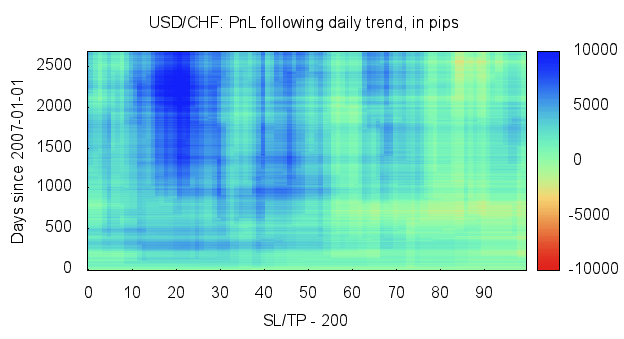
set terminal png
set output "heatmap.png"
set size ratio 0.5
set title "USD/CHF: PnL following daily trend, in pips"

set xlabel "SL/TP - 200"
set ylabel "Days since 2007-01-01"

set tic scale 0

set palette rgbformulae 22,13,10
set palette negative

set cbrange [-10000:10000]
#unset cbtics

set xrange [0:99.5]
set yrange [0:2683]

set view map

splot 'map.txt' matrix with image
Drawing the map
$ gnuplot heatmap.gp && open heatmap.png